
How To Analyse Data in 2025: A Step-by-Step Guide and Expert Tips For Data Management Professionals
“Without big data analytics, companies are blind and deaf, wandering out onto the web like deer on a freeway.” Geoffrey Moore wasn’t exaggerating, businesses that fail to get a grip on their information are already falling behind. Markets move faster, risks multiply quicker, and competitors who know how to analyse data are claiming the ground others hesitate on.
This guide is written to help you take control before the noise drowns out the signals. You will see exactly how to analyse data with focus and intent, not just process for the sake of it. Stay with us, and you will walk away with clear, expert-backed ways to make data work harder for you and keep your decisions sharp in a world that won’t wait.
What’s Inside:
- The Importance of Data Analysis in Data Management
- How To Analyse Data in 2025: 5 Stages of Data Analysis
- Methods of Data Analysis: Key Techniques
- Strategies of Data Analysis for Better Decisions
- How To Analyse Data in 2025: A Sample Guide
- Unlock the Power of Data Analysis with Us
The Importance of Data Analysis in Data Management
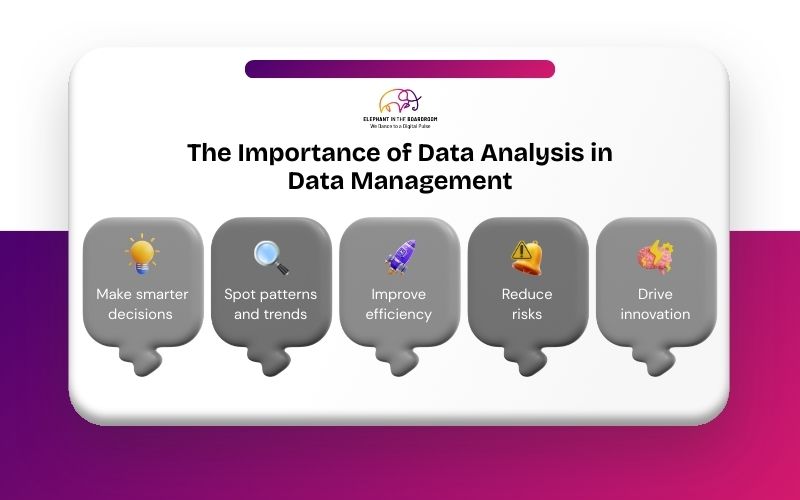
Every dataset tells a story, but only if you know how to listen. Data analysis is the way you uncover that story, connect the dots, and use it to guide smarter choices.
Make Smarter Decisions
When you have the numbers laid out in front of you, you can back every choice with clarity. It takes the uncertainty out of everyday decisions.
Spot Patterns and Trends
By looking at data over time, you can see what’s working and what’s not. This helps you predict outcomes and stay one step ahead.
Improve Efficiency
Analysing data shows you where resources are being wasted. You can then streamline processes and save time and money.
Reduce Risks
Good analysis highlights potential issues before they become big problems. It is like having an early warning system in your toolkit.
Drive Innovation
Fresh insights often lead to new ideas and opportunities. You can use data as a springboard to create better strategies or products.
How To Analyse Data in 2025: 5 Stages of Data Analysis
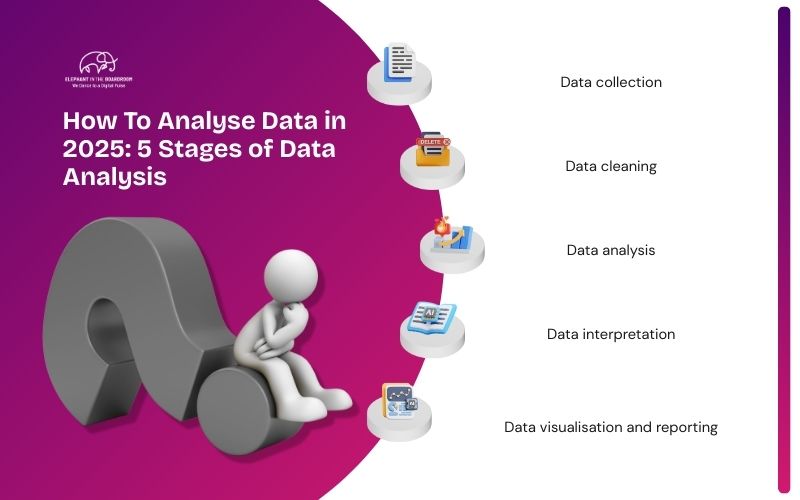
For starters, the question of how to analyse data can be broken down into a cyclical process guiding you from raw data to actionable insights. While the names may vary slightly depending on the source, they are commonly classified into these stages.
Data Collection
This is where you gather all the raw information you need, such as surveys, sales figures, website traffic, or customer feedback. The goal is to bring everything together so you have a solid base to work from.
Data Cleaning
Here you tidy up the data by removing errors, duplicates, or anything that doesn’t add value. Clean data means you can trust the insights that come out of it.
Data Analysis
This is the fun part, digging into the numbers to find patterns, trends, and useful insights. It is about turning raw data into something meaningful for your business.
Data Interpretation
Once you have spotted the trends, you make sense of what they mean for your business. It is about connecting the dots between the numbers and your goals.
Data Visualisation and Reporting
Finally, you present the findings in a way that’s easy to understand, like charts, dashboards, or reports. Clear visuals make it easier for you and your team to take action.
Methods of Data Analysis: Key Techniques
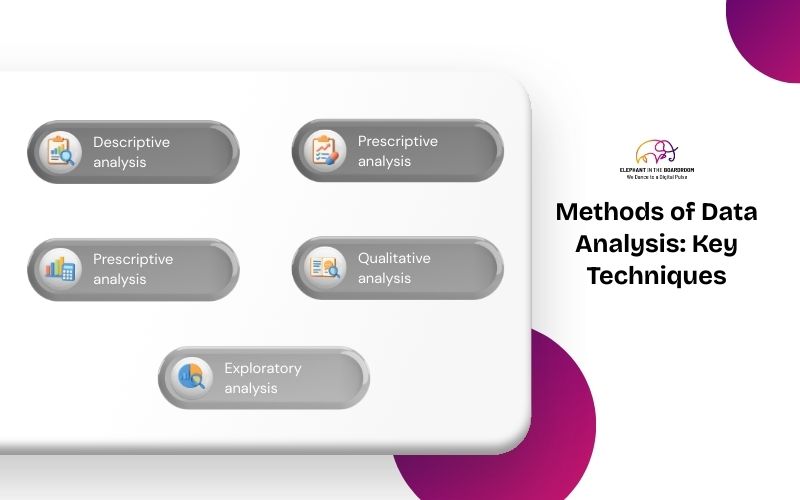
If you have ever wondered how to analyse data in a way that actually helps your business, the answer lies in using the right methods. Each technique gives you a different lens to see what your numbers are really saying.
Descriptive Analysis
This is all about summarising what’s already happened in your business using numbers, charts, or simple reports. It helps you see patterns in your data without diving too deep into the “why” just yet.
Prescriptive Analysis
Here, you don’t just get insights, you get recommendations. It uses data to suggest the best course of action, helping you make decisions with more confidence.
Quantitative Analysis
This is the number-crunching side of things, statistics, financials, and KPIs. It is the kind of analysis that gives you hard evidence to back up your business choices.
Qualitative Analysis
Not all data is numbers, sometimes it is customer feedback, reviews, or comments. Analysing this kind of information helps you understand people’s experiences and perceptions.
Exploratory Analysis
When you don’t yet know what you are looking for, this method helps uncover hidden trends or insights. It is like testing the waters before diving deeper.
Strategies of Data Analysis for Better Decisions
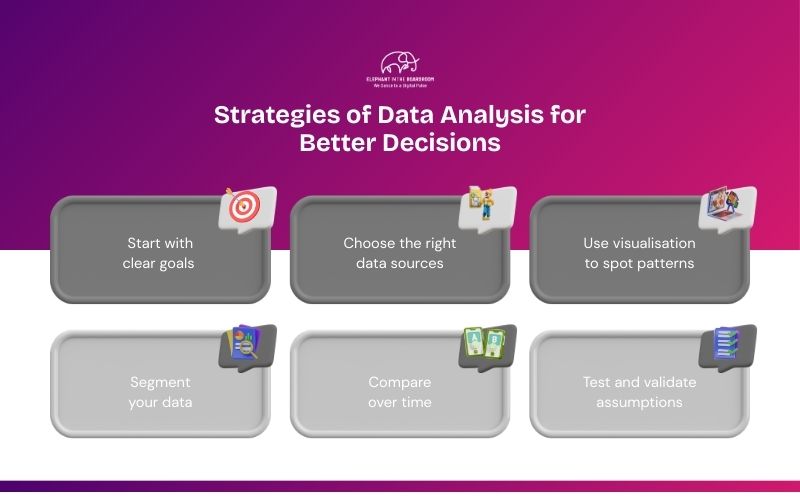
Data analysis strategies go beyond individual methods. They delve into the overall approach you take in transforming data into insights. Analysing your data begins here.
Start with Clear Goals
You will get better results if you know exactly what you are trying to find out. Clear goals help you focus your analysis and avoid drowning in unnecessary data.
Choose the Right Data Sources
Not every dataset will be relevant to your business goals. Focus on data that’s accurate, consistent, and aligned with the decisions you need to make.
Use Visualisation to Spot Patterns
Turning numbers into charts or dashboards helps you see trends at a glance. It makes the story behind the data easier to understand and share with others.
Segment Your Data
Break down your information into groups, like customer types or locations. It makes your insights sharper and shows you where to target your efforts.
Compare Over Time
Looking at your data across weeks, months, or years shows how things are changing. These comparisons help you spot growth, dips, or seasonal patterns that guide smarter decisions.
Test and Validate Assumptions
Don’t just assume your first insight is correct, test it with different datasets or scenarios. Validating your assumptions helps you avoid costly mistakes.
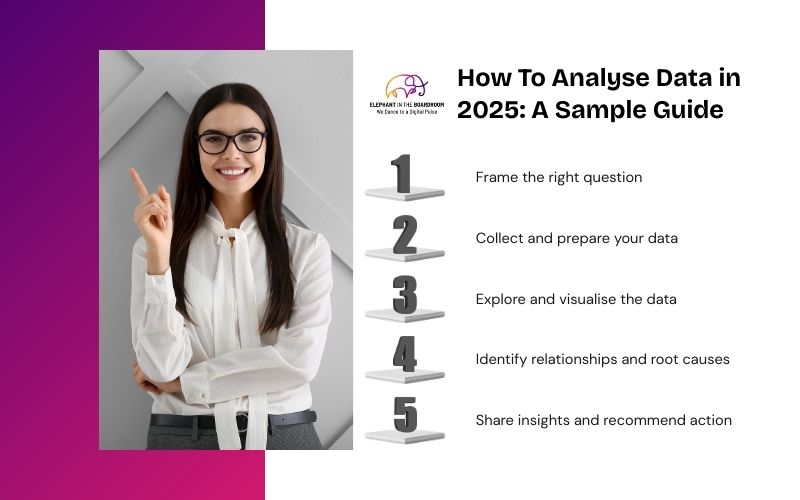
How To Analyse Data in 2025: A Sample Guide
Asking how to do data analysis is more interesting now as it's your turn to do it. From the previous data analysis strategies and stages, treating data as a friend is more crucial than ever.
If all these steps need more elaboration, here's an example of how to effectively apply data analysis strategies for your business.
Say Emily, a data management professional, works for a subscription-based fitness app. Retention is a key metric for the app's success, so Emily is tasked with analysing customer churn to identify trends and develop strategies to keep users engaged.
Here's the process she must follow for a successful data analysis
Step 1: Frame the Right Question
Before diving in, Emily defines what she’s really trying to uncover, why users are leaving the app. Having a sharp question keeps her analysis targeted and avoids wasting time on irrelevant details.
Step 2: Collect and Prepare Your Data
She gathers customer activity logs, cancellation feedback, and usage patterns. Cleaning and organising this data ensures she’s basing her insights on accurate and consistent information.
Step 3: Explore and Visualise the Data
Emily uses charts and dashboards to see when and where churn is happening. Visualisation makes trends easier to spot and communicate, turning raw numbers into a clear story.
Step 4: Identify Relationships and Root Causes
She looks for links between behaviour and churn, such as reduced logins or fewer completed workouts. Understanding these drivers helps pinpoint the real issues behind customer drop-off.
Step 5: Share Insights and Recommend Action
Emily pulls everything together into a story that the leadership team can act on. She doesn’t just present numbers, she recommends solutions, like personalised workout nudges, to improve retention.
Unlock the Power of Data Analysis with Us
Like Emily, you don’t need to overcomplicate the process, just break it down, stay curious, and let your data guide you. If data analysis still feels overwhelming, Elephant in the Boardroom is here to make it simple, actionable, and effective. Data has the power to transform your business decisions. Connect with our team today and start unlocking its full potential.